# 7.饼状图(midea-piechart-view)
APP内置组件,可直接在template中使用,不需要import导入和注册 。
# 实例
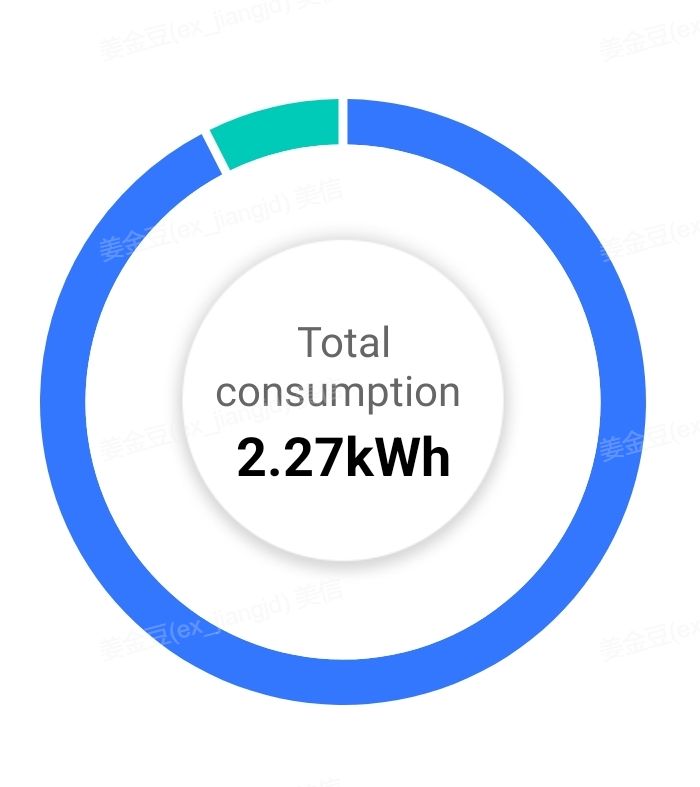
# 基础用法
<template>
  <div>
    <scroller class="scroller">
        <div class="page-module">
            <div style="height: 500px;margin-top:100px;">
            <midea-piechart-view
                v-if="showChart"
                class="line-chart"
                :data="pieData"
            ></midea-piechart-view>
        </div>
        </div>
    </scroller>
  </div>
</template>
<script>

export default {
  data() {
    return {
        pieData: {
                    type: 3,
                    data: {
                        name: 'My Device',
                        piechartdata: {
                            unit: 'kWh',
                            piename: 'Total ',
                            total: 3,
                            sliceSpace: 1,
                            totalnumber: 9874,
                            datalist:[
                                    {
                                        eachname: 'name',
                                        numdata: '40%',
                                        colorvalue: '#f00ff0'
                                    },
                                    {
                                        eachname: 'name',
                                        numdata: '60%',
                                        colorvalue: '#fffff0'
                                    }
                            ]
                        }
                    }
                }
    };
  },

  }
</script>
# Attributes
| Prop | Type | Required | Default | Description |
|---|---|---|---|---|
| type | String | Y | 地图类型,'': 电子围栏地图,带范围圈;'common': 普通地图 | |
| style | Object | Y | 地图组件大小样式,具体见上述代码 | |
| unit | String | N | - | 单位 |
| piename | String | N | - | 饼图中间的文字 |
| total | Number | N | - | 饼图分几等分 |
| sliceSpace | Number | N | - | IOS属性,色块之间的间隔,固定为1 |
| totalnumber | Number | N | - | 饼图中间的数字,总数 |
| holeRadiusPercent | Number | N | - | 外圈圆的的圆占比 |
| style | Number | N | - | 饼状图中心描述和数据位置。 0: 默认是数量在下,描述在上。 1:位置反过来 |
| labelMaxLength | Number | N | - | 标识label 可以显示的最大的字符数 |
| itemLabelShow | Boolean | N | - | 展示每个圆环代表的模块线 |
| hideCenterShadow | Boolean | N | - | 隐藏中间的圆环 |
| lineMarginAlignment | Boolean | N | - | - |
| entryLabelColor | String | N | - | 线下面文字的颜色 |
| valueLineColor | String | N | - | 线的颜色k |
| circleColor | String | N | #FFFFFF | 中间圆颜色 |
| totalNumberColor | String | N | #FF0000 | 中间值(55.01kwh)颜色 |
| pienameColor | String | N | #3377FF | label(总能耗)颜色 |
# 注1
| Prop | Type | Required | Default | Description |
|---|---|---|---|---|
| eachname | String | N | - | 色块代表的部分的名称 |
| numdata | String | Y | - | 占比 |
| colorvalue | String | Y | - | 色块代表需要展示的颜色色值 |