# 8.折线图(midea-linechart-view)
APP内置组件,可直接在template中使用,不需要import导入和注册 。
# 实例
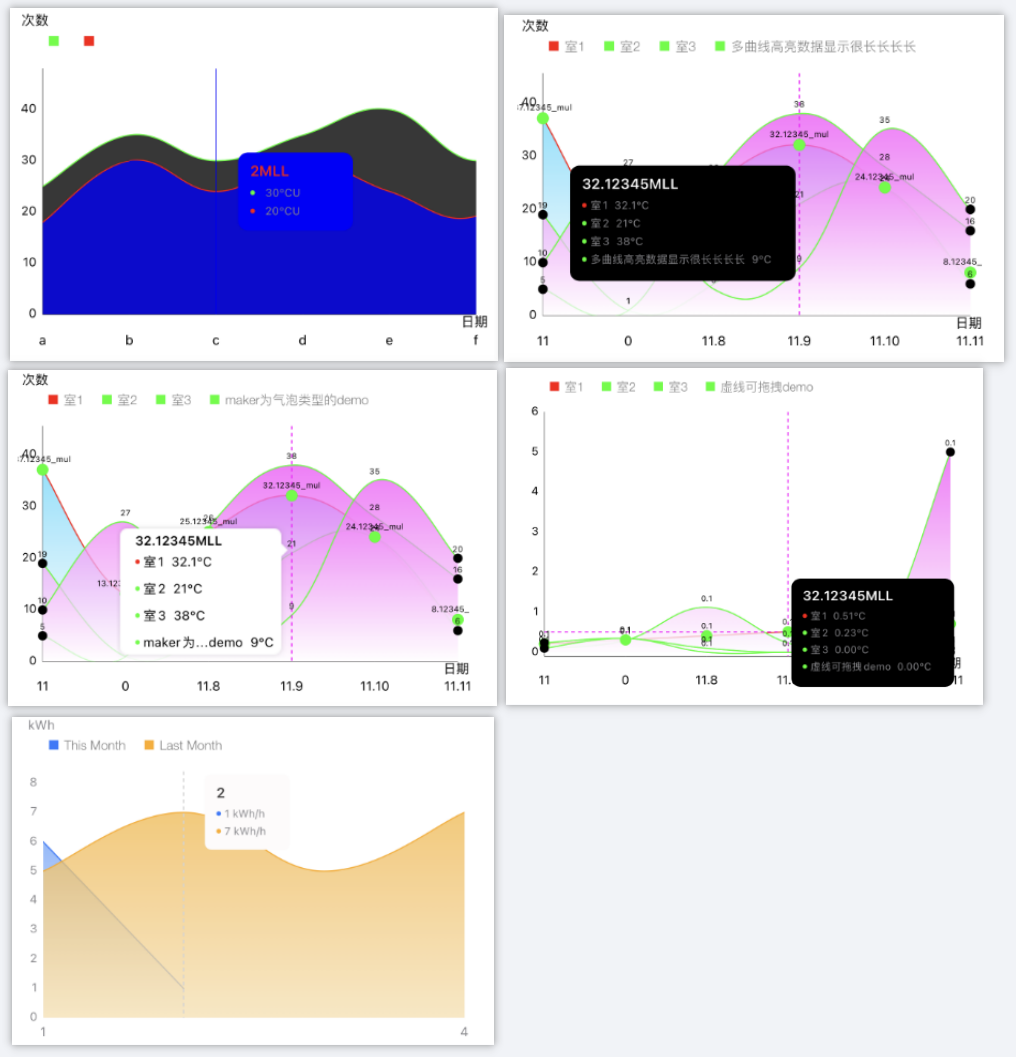
# 基础用法
<template>
<list class="list">
<cell class="content-wrapper">
<div class="linechart-wrapper">
<midea-linechart-view class="linechart" :data="SinglechartData"></midea-linechart-view>
</div>
<div class="linechart-wrapper">
<midea-linechart-view class="linechart" :data="mulLineData"></midea-linechart-view>
</div>
<div class="linechart-wrapper">
<midea-linechart-view class="linechart" :data="bubleStyleMarkerData"></midea-linechart-view>
</div>
<div class="linechart-wrapper">
<midea-linechart-view class="linechart" :data="mulLineDataWithPerPan"></midea-linechart-view>
</div>
<div class="linechart-wrapper">
<midea-linechart-view class="linechart" :data="staticData"></midea-linechart-view>
</div>
</cell>
</list>
</template>
<style scoped>
.linechart-wrapper {
margin-top: 40px;
padding-bottom: 40px;
width: 750px;
height: 600px;
background-color: #ffffff;
border-radius: 16px;
}
.content-wrapper {
align-items: center;
width: 750px;
}
.linechart {
width: 700;
margin-top: 20px;
margin-left: 10px;
margin-right: 10px;
margin-bottom: 20px;
height: 500px;
}
</style>
<script>
// //随机生成[0,40]随机数
// const dataCount = 6
const generateSequence = function(dataCount) {
let arr = []
for (let i = 0; i < dataCount; i++) {
arr.push(i)
}
return arr
}
const randomNum = function(dataCount, value) {
let arr = []
for (let i = 0; i < dataCount; i++) {
var random = Math.floor(Math.random() * value)
if (i < 0) {
arr.push(0)
} else {
arr.push(random)
}
}
return arr
}
const singleLineXValue = generateSequence(40)
const singleLineYValues = randomNum(40, 40).map(x => x + 0.12345)
const singleLineYLabels = singleLineXValue.map(x => x + '_sin')
const singleMarkerLabels = singleLineXValue.map(x => x + 'MLL')
const multiLineXValue = generateSequence(16)
const multiLineYValues = randomNum(16, 40).map(x => x + 0.12345)
const multiLineYLabels = multiLineYValues.map(x => x + '_mul')
const multiMarkerLabels = multiLineYValues.map(x => x + 'MLL')
const multiLineXValue_perdrag = generateSequence(6)
const multiLineYValues_perdrag1 = randomNum(6, 1).map(x => x)
const multiLineYLabels_perdrag1 = multiLineYValues_perdrag1.map(x => x + '_mul1')
const multiLineYValues_perdrag2 = randomNum(6, 1).map(x => x)
const multiLineYLabels_perdrag2 = multiLineYValues_perdrag2.map(x => x + '_mul2')
const multiLineYValues_perdrag3 = randomNum(6, 1).map(x => x)
const multiLineYLabels_perdrag3 = multiLineYValues_perdrag3.map(x => x + '_mul3')
const multiLineYValues_perdrag4 = randomNum(6, 1).map(x => x)
const multiLineYLabels_perdrag4 = multiLineYValues_perdrag4.map(x => x + '_mul4')
const lowRandomNum2 = randomNum(6, 40).map(x => x)
const lowRandomNum3 = randomNum(6, 40).map(x => x)
const lowRandomNum4 = randomNum(6, 40).map(x => x)
export default {
created() {},
data() {
return {
SinglechartData: {
marker: {
markerShow: true, //默认为false,不显示maker
markerColor: '#0000ff', //默认为黑色,marker的背景色
markerTextColor: '#ff0000', //默认白色,marker字体字颜色
markerTextSize: '12', //默认12
markerCornerRadius: '15', //圆角
markerGraduationLabel: '℃U', //显示单位 默认为空""
markerOffsetY: 50, //垂直间距设置
markerMarginX: 150,
markerType: 1,
markermaximumFractionDigits: 4,
isListStyleMarker: true
},
yValueDecimal: 3, //优先级高于markermaximumFractionDigits
visibleXRangeMaximum: 5,
// scaleType: 3, //"scaleType":0,//0-x,y都可以缩放,1-x,y都不可缩放,2-只有x可缩放,3-只有y可缩放。 默认是1
// dragType: 0, //"dragType":0,//0-x,y都可以拖拽,1-x,y都不可拖拽,2-只有x可拖拽,3-只有y可拖拽. 默认是0
barSelectIndex: 4,
x: {
value: singleLineXValue,
label: ['a', 'b', 'c', 'd', 'e', 'f', 'g', 'h', 'h', 'i', 'j', 'k', 'l', 'm', 'n'],
markerLabel: singleMarkerLabels
},
y: [
{
value: [25, 35, 30, 35, 40, 30, 38, 25, 28, 38, 15, 20],
title: '',
color: '#00FF00', //折线颜色
labelColor: '#000000',
labelSize: 0,
smooth: '1',
isDrawHighLightCircles: true,
highLightEnable: true,
cirlceColor: '#FF0000',
circleRadius: 10,
highLightColor: '#0000ff',
isVerticalHighlightIndicatorEnabled: true,
isDrawCircles: false,
fillColor: '#000000'
},
{
value: [15, 25, 20, 25, 20, 16, 28, 15, 18, 24, 5, 12],
title: '',
labelColor: '#000000',
labelSize: 0,
smooth: '1',
color: '#FF0000', //折线颜色
isDrawHighLightCircles: true,
highLightEnable: true,
cirlceColor: '#00ffFF',
circleRadius: 10,
highLightColor: '#0000ff',
isVerticalHighlightIndicatorEnabled: true,
isDrawCircles: false,
fillColor: '#0000FF',
axisDependency: 'right'
}
],
xAxisColor: '#000000', //x轴线的颜色,如果不设置,则默认是黑色线
xAxisLabelColor: '#000000', //x label的字体颜色,如果不设置,则默认是黑色字体颜色
yAxisColor: '#000000', //y轴线的颜色,如果不设置,则默认是黑色线
yAxisLabelColor: '#000000', // label的字体颜色,如果不设置,则默认是黑色字体颜色
background: '#ffffff', //不传,则默认使用透明背景
xAxisGridColor: '#ffffff', //x轴上分割线颜色
xAxisGridAlpha: 0.5, //x轴上分割线透明度
granularity: 1, //间距本身是自适应的,可以使用该值进行调整间距的比例,比如自适应间距是20px,granularity设置为2的时候,界面显示的间距为 40px
yAxisLabelShow: true, //是否只显示最大最小值,true: 显示y轴值;false: 不显示y轴值;默认true
description: '',
legend: {
position: 'TOP_LEFT', //"TOP_LEFT"/"TOP_RIGHT"
orientation: 'HORIZONTAL' //"HORIZONTAL"/"BOTTOM_RIGHT"
},
legendHide: false, //是否需要隐藏legend,默认不隐藏
unit: {
x: '日期',
y: '次数'
}
},
mulLineData: {
marker: {
//ChartMarkerView
// extraInfo: {
// title: '行2',
// value: ['exv1', 'exv2', 'exv3']
// },
markerShow: true, //默认为false,不显示maker
markerColor: '#000000', //默认为黑色,marker的背景色
markerTextColor: '#ffffff', //默认白色,marker字体字颜色
markerTextSize: '12', //默认12
markerCornerRadius: '0', //圆角
markerGraduationLabel: '℃', //显示单位 默认为空""
markerOffsetY: 0, //垂直间距设置
markerOffsetX: 3,
barSelectIndex: 1,
markerType: 1, //需要为1,多曲线才能显示
isListStyleMarker: true
},
optimizeHighlightPerDrag: false,
visibleXRangeMaximum: 5,
scaleType: 1, //"scaleType":0,//0-x,y都可以缩放,1-x,y都不可缩放,2-只有x可缩放,3-只有y可缩放。 默认是1
dragType: 0, //"dragType":0,//0-x,y都可以拖拽,1-x,y都不可拖拽,2-只有x可拖拽,3-只有y可拖拽. 默认是0
x: {
value: multiLineXValue,
label: [11, 0, '11.8', '11.9', '11.10', '11.11', '11.12'],
markerLabel: multiMarkerLabels
},
y: [
{
value: multiLineYValues,
label: multiLineYLabels,
title: '室1',
color: '#FF0000', //折线颜色
starcolor: '#ffffff', //区域背景渐变开始颜色(从下自上)
endcolor: '#2AD2FC', //区域背景渐变结束颜色(从下自上)
smooth: 1, //0直线,1平滑
lineSidesPointAble: true, //首尾可以设置是否有端点,默认false
lineSidesPointRadius: 4, //端点大小,端点的半径值大小,lineSidesPointAble为ture有效
lineSidesPointColor: '#000000', //端点颜色,lineSidesPointAble为ture有效
lineDashAble: false, //曲线的类型可调: 是否使用虚线,默认false
isDrawCircles: true,
circleColor: '#00FF00',
circleRadius: 5,
//lineTypeList: [0, 0, 0, 1, 0, 1, 0, 1, 0, 1, 0, 1, 0, 1, 0, 1, 0, 1, 0, 1],
highLineDashAble: true,
isVerticalHighlightIndicatorEnabled: true,
isHorizontalHighlightIndicatorEnabled: true,
highLightColor: '#FF00FF',
highLightLineWidth: 1
},
{
value: lowRandomNum2,
label: lowRandomNum2,
title: '室2',
color: '#00FF00', //折线颜色
starcolor: '#ffffff', //区域背景渐变开始颜色(从下自上)
endcolor: '#FF00FC', //区域背景渐变结束颜色(从下自上)
smooth: 1, //0直线,1平滑
lineSidesPointAble: true, //首尾可以设置是否有端点,默认false
lineSidesPointRadius: 4, //端点大小,端点的半径值大小,lineSidesPointAble为ture有效
lineSidesPointColor: '#000000', //端点颜色,lineSidesPointAble为ture有效
lineDashAble: false, //曲线的类型可调: 是否使用虚线,默认false
highLineDashAble: true,
isVerticalHighlightIndicatorEnabled: true,
isHorizontalHighlightIndicatorEnabled: false,
highLightColor: '#FF00FF',
highLightLineWidth: 1
},
{
value: lowRandomNum3,
label: lowRandomNum3,
title: '室3',
color: '#00FF00', //折线颜色
starcolor: '#ffffff', //区域背景渐变开始颜色(从下自上)
endcolor: '#FF00FC', //区域背景渐变结束颜色(从下自上)
smooth: 1, //0直线,1平滑
lineSidesPointAble: true, //首尾可以设置是否有端点,默认false
lineSidesPointRadius: 4, //端点大小,端点的半径值大小,lineSidesPointAble为ture有效
lineSidesPointColor: '#000000', //端点颜色,lineSidesPointAble为ture有效
lineDashAble: false, //曲线的类型可调: 是否使用虚线,默认false
highLineDashAble: true,
isVerticalHighlightIndicatorEnabled: true,
isHorizontalHighlightIndicatorEnabled: true,
highLightColor: '#FF00FF',
highLightLineWidth: 1
},
{
value: lowRandomNum4,
label: lowRandomNum4,
title: '多曲线高亮数据显示很长长长长',
color: '#00FF00', //折线颜色
starcolor: '#ffffff', //区域背景渐变开始颜色(从下自上)
endcolor: '#FF00FC', //区域背景渐变结束颜色(从下自上)
smooth: 1, //0直线,1平滑
lineSidesPointAble: true, //首尾可以设置是否有端点,默认false
lineSidesPointRadius: 4, //端点大小,端点的半径值大小,lineSidesPointAble为ture有效
lineSidesPointColor: '#000000', //端点颜色,lineSidesPointAble为ture有效
lineDashAble: false, //曲线的类型可调: 是否使用虚线,默认false
highLineDashAble: true,
isVerticalHighlightIndicatorEnabled: true,
isHorizontalHighlightIndicatorEnabled: false,
highLightColor: '#FF00FF',
highLightLineWidth: 1
}
],
xAxisColor: '#000000', //x轴线的颜色,如果不设置,则默认是黑色线
xAxisLabelColor: '#000000', //x label的字体颜色,如果不设置,则默认是黑色字体颜色
yAxisColor: '#000000', //y轴线的颜色,如果不设置,则默认是黑色线
yAxisLabelColor: '#000000', // label的字体颜色,如果不设置,则默认是黑色字体颜色
background: '#ffffff', //不传,则默认使用透明背景
xAxisGridColor: '#ffffff', //x轴上分割线颜色
xAxisGridAlpha: 0.5, //x轴上分割线透明度
granularity: 1.2, //间距本身是自适应的,可以使用该值进行调整间距的比例,比如自适应间距是20px,granularity设置为2的时候,界面显示的间距为 40px
yAxisLabelShow: true, //是否只显示最大最小值,true: 显示y轴值;false: 不显示y轴值;默认true
description: '',
legend: {
position: 'TOP_LEFT', //"TOP_LEFT"/"TOP_RIGHT"
orientation: 'HORIZONTAL' //"HORIZONTAL"/"BOTTOM_RIGHT"
},
legendHide: false, //是否需要隐藏legend,默认不隐藏
unit: {
x: '日期',
y: '次数'
}
},
bubleStyleMarkerData: {
marker: {
//ChartMarkerView
// extraInfo: {
// title: '行2',
// value: ['exv1', 'exv2', 'exv3']
// },
markerMaxWidth: 150,
makerTextTruncate: 2,
markerShow: true, //默认为false,不显示maker
markerColor: '#ffffff', //气泡样式设置该值无效
markerTextColor: '#000000', //默认白色,marker字体字颜色
markerTextSize: '11', //默认12
markerCornerRadius: '0', //圆角
markerGraduationLabel: '℃', //显示单位 默认为空""
markerOffsetY: 0, //垂直间距设置
markerOffsetX: 3,
markerType: 1, //需要为1,多曲线才能显示
isListStyleMarker: true
},
barSelectIndex: 3,
optimizeHighlightPerDrag: false,
visibleXRangeMaximum: 5,
scaleType: 1, //"scaleType":0,//0-x,y都可以缩放,1-x,y都不可缩放,2-只有x可缩放,3-只有y可缩放。 默认是1
dragType: 0, //"dragType":0,//0-x,y都可以拖拽,1-x,y都不可拖拽,2-只有x可拖拽,3-只有y可拖拽. 默认是0
x: {
value: multiLineXValue,
label: [11, 0, '11.8', '11.9', '11.10', '11.11', '11.12'],
markerLabel: multiMarkerLabels
},
y: [
{
value: multiLineYValues,
label: multiLineYLabels,
title: '室1',
color: '#FF0000', //折线颜色
starcolor: '#ffffff', //区域背景渐变开始颜色(从下自上)
endcolor: '#2AD2FC', //区域背景渐变结束颜色(从下自上)
smooth: 1, //0直线,1平滑
lineSidesPointAble: true, //首尾可以设置是否有端点,默认false
lineSidesPointRadius: 4, //端点大小,端点的半径值大小,lineSidesPointAble为ture有效
lineSidesPointColor: '#000000', //端点颜色,lineSidesPointAble为ture有效
lineDashAble: false, //曲线的类型可调: 是否使用虚线,默认false
isDrawCircles: true,
circleColor: '#00FF00',
circleRadius: 5,
//lineTypeList: [0, 0, 0, 1, 0, 1, 0, 1, 0, 1, 0, 1, 0, 1, 0, 1, 0, 1, 0, 1],
highLineDashAble: true,
isVerticalHighlightIndicatorEnabled: true,
isHorizontalHighlightIndicatorEnabled: true,
highLightColor: '#FF00FF',
highLightLineWidth: 1
},
{
value: lowRandomNum2,
label: lowRandomNum2,
title: '室2',
color: '#00FF00', //折线颜色
starcolor: '#ffffff', //区域背景渐变开始颜色(从下自上)
endcolor: '#FF00FC', //区域背景渐变结束颜色(从下自上)
smooth: 1, //0直线,1平滑
lineSidesPointAble: true, //首尾可以设置是否有端点,默认false
lineSidesPointRadius: 4, //端点大小,端点的半径值大小,lineSidesPointAble为ture有效
lineSidesPointColor: '#000000', //端点颜色,lineSidesPointAble为ture有效
lineDashAble: false, //曲线的类型可调: 是否使用虚线,默认false
highLineDashAble: true,
isVerticalHighlightIndicatorEnabled: true,
isHorizontalHighlightIndicatorEnabled: false,
highLightColor: '#FF00FF',
highLightLineWidth: 1
},
{
value: lowRandomNum3,
label: lowRandomNum3,
title: '室3',
color: '#00FF00', //折线颜色
starcolor: '#ffffff', //区域背景渐变开始颜色(从下自上)
endcolor: '#FF00FC', //区域背景渐变结束颜色(从下自上)
smooth: 1, //0直线,1平滑
lineSidesPointAble: true, //首尾可以设置是否有端点,默认false
lineSidesPointRadius: 4, //端点大小,端点的半径值大小,lineSidesPointAble为ture有效
lineSidesPointColor: '#000000', //端点颜色,lineSidesPointAble为ture有效
lineDashAble: false, //曲线的类型可调: 是否使用虚线,默认false
highLineDashAble: true,
isVerticalHighlightIndicatorEnabled: true,
isHorizontalHighlightIndicatorEnabled: true,
highLightColor: '#FF00FF',
highLightLineWidth: 1
},
{
value: lowRandomNum4,
label: lowRandomNum4,
title: 'maker为气泡类型的demo',
color: '#00FF00', //折线颜色
starcolor: '#ffffff', //区域背景渐变开始颜色(从下自上)
endcolor: '#FF00FC', //区域背景渐变结束颜色(从下自上)
smooth: 1, //0直线,1平滑
lineSidesPointAble: true, //首尾可以设置是否有端点,默认false
lineSidesPointRadius: 4, //端点大小,端点的半径值大小,lineSidesPointAble为ture有效
lineSidesPointColor: '#000000', //端点颜色,lineSidesPointAble为ture有效
lineDashAble: false, //曲线的类型可调: 是否使用虚线,默认false
highLineDashAble: true,
isVerticalHighlightIndicatorEnabled: true,
isHorizontalHighlightIndicatorEnabled: false,
highLightColor: '#FF00FF',
highLightLineWidth: 1
}
],
xAxisColor: '#000000', //x轴线的颜色,如果不设置,则默认是黑色线
xAxisLabelColor: '#000000', //x label的字体颜色,如果不设置,则默认是黑色字体颜色
yAxisColor: '#000000', //y轴线的颜色,如果不设置,则默认是黑色线
yAxisLabelColor: '#000000', // label的字体颜色,如果不设置,则默认是黑色字体颜色
background: '#ffffff', //不传,则默认使用透明背景
xAxisGridColor: '#ffffff', //x轴上分割线颜色
xAxisGridAlpha: 0.5, //x轴上分割线透明度
granularity: 1.2, //间距本身是自适应的,可以使用该值进行调整间距的比例,比如自适应间距是20px,granularity设置为2的时候,界面显示的间距为 40px
yAxisLabelShow: true, //是否只显示最大最小值,true: 显示y轴值;false: 不显示y轴值;默认true
description: '',
legend: {
position: 'TOP_LEFT', //"TOP_LEFT"/"TOP_RIGHT"
orientation: 'HORIZONTAL' //"HORIZONTAL"/"BOTTOM_RIGHT"
},
legendHide: false, //是否需要隐藏legend,默认不隐藏
unit: {
x: '日期',
y: '次数'
}
},
mulLineDataWithPerPan: {
marker: {
//ChartMarkerView
// extraInfo: {
// title: '行2',
// value: ['exv1', 'exv2', 'exv3']
// },
markerShow: true, //默认为false,不显示maker
markerColor: '#000000', //默认为黑色,marker的背景色
markerTextColor: '#ffffff', //默认白色,marker字体字颜色
markerTextSize: '12', //默认12
markerCornerRadius: '0', //圆角
markerGraduationLabel: '℃', //显示单位 默认为空""
markerOffsetY: 0, //垂直间距设置
markerOffsetX: 3,
markermaximumFractionDigits: 2,
markerType: 1, //需要为1,多曲线才能显示
isListStyleMarker: true,
trimSuffixFragction: false
},
optimizeHighlightPerDrag: false,
visibleXRangeMaximum: 5,
scaleType: 2, //"scaleType":0,//0-x,y都可以缩放,1-x,y都不可缩放,2-只有x可缩放,3-只有y可缩放。 默认是1
dragType: 0, //"dragType":0,//0-x,y都可以拖拽,1-x,y都不可拖拽,2-只有x可拖拽,3-只有y可拖拽. 默认是0
x: {
value: multiLineXValue_perdrag,
label: [11, 0, '11.8', '11.9', '11.10', '11.11', '11.12'],
markerLabel: multiMarkerLabels
},
y: [
{
value: [0.21, 0.31, 0.41, 0.51, 0.61, 0.71],
label: ['0.1', '0.1', '0.1', '0.1', '0.1', '0.1'],
title: '室1',
color: '#FF0000', //折线颜色
starcolor: '#ffffff', //区域背景渐变开始颜色(从下自上)
endcolor: '#2AD2FC', //区域背景渐变结束颜色(从下自上)
smooth: 1, //0直线,1平滑
lineSidesPointAble: true, //首尾可以设置是否有端点,默认false
lineSidesPointRadius: 4, //端点大小,端点的半径值大小,lineSidesPointAble为ture有效
lineSidesPointColor: '#000000', //端点颜色,lineSidesPointAble为ture有效
lineDashAble: false, //曲线的类型可调: 是否使用虚线,默认false
isDrawCircles: true,
circleColor: '#00FF00',
circleRadius: 5,
//lineTypeList: [0, 0, 0, 1, 0, 1, 0, 1, 0, 1, 0, 1, 0, 1, 0, 1, 0, 1, 0, 1],
highLineDashAble: true,
isVerticalHighlightIndicatorEnabled: true,
isHorizontalHighlightIndicatorEnabled: true,
highLightColor: '#FF00FF',
highLightLineWidth: 1
},
{
value: [0.1, 0.3, 1.1234, 0.2341, -0.1, 5],
label: ['0.1', '0.1', '0.1', '0.1', '0.1', '0.1'],
title: '室2',
color: '#00FF00', //折线颜色
starcolor: '#ffffff', //区域背景渐变开始颜色(从下自上)
endcolor: '#FF00FC', //区域背景渐变结束颜色(从下自上)
smooth: 1, //0直线,1平滑
lineSidesPointAble: true, //首尾可以设置是否有端点,默认false
lineSidesPointRadius: 4, //端点大小,端点的半径值大小,lineSidesPointAble为ture有效
lineSidesPointColor: '#000000', //端点颜色,lineSidesPointAble为ture有效
lineDashAble: false, //曲线的类型可调: 是否使用虚线,默认false
highLineDashAble: true,
isVerticalHighlightIndicatorEnabled: true,
isHorizontalHighlightIndicatorEnabled: false,
highLightColor: '#FF00FF',
highLightLineWidth: 1
},
{
value: [0.2345, 0.342346, 0.1, 0.0001, 0.1, 0.1],
label: ['0.1', '0.1', '0.1', '0.1', '0.1', '0.1'],
title: '室3',
color: '#00FF00', //折线颜色
starcolor: '#ffffff', //区域背景渐变开始颜色(从下自上)
endcolor: '#FF00FC', //区域背景渐变结束颜色(从下自上)
smooth: 1, //0直线,1平滑
lineSidesPointAble: true, //首尾可以设置是否有端点,默认false
lineSidesPointRadius: 4, //端点大小,端点的半径值大小,lineSidesPointAble为ture有效
lineSidesPointColor: '#000000', //端点颜色,lineSidesPointAble为ture有效
lineDashAble: false, //曲线的类型可调: 是否使用虚线,默认false
highLineDashAble: true,
isVerticalHighlightIndicatorEnabled: true,
isHorizontalHighlightIndicatorEnabled: true,
highLightColor: '#FF00FF',
highLightLineWidth: 1
},
{
value: [0.1, 0.345, 0, 0, 0, 0],
label: ['0.1', '0.1', '0.1', '0.1', '0.1', '0.1'],
title: '虚线可拖拽demo',
color: '#00FF00', //折线颜色
starcolor: '#ffffff', //区域背景渐变开始颜色(从下自上)
endcolor: '#FF00FC', //区域背景渐变结束颜色(从下自上)
smooth: 1, //0直线,1平滑
lineSidesPointAble: true, //首尾可以设置是否有端点,默认false
lineSidesPointRadius: 4, //端点大小,端点的半径值大小,lineSidesPointAble为ture有效
lineSidesPointColor: '#000000', //端点颜色,lineSidesPointAble为ture有效
lineDashAble: false, //曲线的类型可调: 是否使用虚线,默认false
highLineDashAble: true,
isVerticalHighlightIndicatorEnabled: true,
isHorizontalHighlightIndicatorEnabled: false,
highLightColor: '#FF00FF',
highLightLineWidth: 1
}
],
xAxisColor: '#000000', //x轴线的颜色,如果不设置,则默认是黑色线
xAxisLabelColor: '#000000', //x label的字体颜色,如果不设置,则默认是黑色字体颜色
yAxisColor: '#000000', //y轴线的颜色,如果不设置,则默认是黑色线
yAxisLabelColor: '#000000', // label的字体颜色,如果不设置,则默认是黑色字体颜色
background: '#ffffff', //不传,则默认使用透明背景
xAxisGridColor: '#ffffff', //x轴上分割线颜色
xAxisGridAlpha: 0.5, //x轴上分割线透明度
granularity: 1.2, //间距本身是自适应的,可以使用该值进行调整间距的比例,比如自适应间距是20px,granularity设置为2的时候,界面显示的间距为 40px
yAxisLabelShow: true, //是否只显示最大最小值,true: 显示y轴值;false: 不显示y轴值;默认true
description: '',
legend: {
position: 'TOP_LEFT', //"TOP_LEFT"/"TOP_RIGHT"
orientation: 'HORIZONTAL' //"HORIZONTAL"/"BOTTOM_RIGHT"
},
legendHide: false, //是否需要隐藏legend,默认不隐藏
unit: {
x: '日期',
y: ''
}
},
staticData: {
marker: {
//ChartMarkerView
// extraInfo: {
// title: '行2',
// value: ['exv1', 'exv2', 'exv3']
// },
showYTitle: false,
markerShow: true, //默认为false,不显示maker
markerColor: '#fdfbfb', //默认为黑色,marker的背景色
markerTextColor: '#444242', //默认白色,marker字体字颜色
markerTextSize: '12', //默认12
markerCornerRadius: 6, //圆角
markerGraduationLabel: ' kWh/h', //显示单位 默认为空""
markerOffsetY: 0, //垂直间距设置
markerType: 1, //需要为1,多曲线才能显示
isListStyleMarker: true,
highLineDashAble: true,
isVerticalHighlightIndicatorEnabled: true,
isHorizontalHighlightIndicatorEnabled: false
},
x: {
value: [1, 2, 3, 4],
markerLabel: [1, 2, 3, 4],
label: [1, '', '', 4]
},
y: [
{
// "value": [1, 1,1,1,1,1,1,1,1,1,1,1,1,1,1,1,1,1,1,1,1,1,1,1,1,1,1,1,1,1],
value: [6, 1],
//
title: 'This Month',
color: '#267AFF', //折线颜色
starcolor: '#ffffff', //区域背景渐变开始颜色(从下自上)
endcolor: '#1B81FB', //区域背景渐变结束颜色(从下自上)
smooth: 1, //0直线,1平滑
// "lineSidesPointAble" : true, //首尾可以设置是否有端点,默认false
// "lineSidesPointRadius" : 4, //端点大小,端点的半径值大小,lineSidesPointAble为ture有效
// "lineSidesPointColor" : "#000000", //端点颜色,lineSidesPointAble为ture有效
// "lineDashAble" : true, //曲线的类型可调: 是否使用虚线,默认false
highLineDashAble: true,
isVerticalHighlightIndicatorEnabled: true,
isHorizontalHighlightIndicatorEnabled: false,
highLightColor: '#d5d5d5',
highLightLineWidth: 1
//label: ['custom_a1', 'custom_a2', 'custom_a3', 'custom_a4'],
// lineTypeList: [1, 1, 1, 1]
},
{
value: [5, 7, 5, 7],
title: 'Last Month',
color: '#FFAA10', //折线颜色
starcolor: '#fae0b1', //区域背景渐变开始颜色(从下自上)
endcolor: '#f9b12f', //区域背景渐变结束颜色(从下自上)
smooth: 1, //0直线,1平滑
highLineDashAble: true,
isVerticalHighlightIndicatorEnabled: true,
isHorizontalHighlightIndicatorEnabled: false,
highLightColor: '#d5d5d5',
highLightLineWidth: 1
//label: ['custom_b1', 'custom_b2', 'custom_b3', 'custom_b4'],
// lineTypeList: [1, 1, 1, 1]
}
// {
// // "value": [5, 5, 5, 5, 5, 5, 5],
// // "label": [5, 6, 3, 4, 1, 5, 2],
// "title": "Monthly Target",
// "color": "#00CBB8", //折线颜色
// // "starcolor": "#ffffff", //区域背景渐变开始颜色(从下自上)
// // "endcolor": "#1B81FB", //区域背景渐变结束颜色(从下自上)
// "smooth":1, //0直线,1平滑
// "lineDashAble" : true,
// highLineDashAble: true,
// isVerticalHighlightIndicatorEnabled: true,
// isHorizontalHighlightIndicatorEnabled: false,
// highLightColor: '#d5d5d5',
// highLightLineWidth: 1
// }
],
// visibleXRangeMaximum:5,// 可视区域最大数据数量
xAxisColor: '#ffffff', //x轴线的颜色,如果不设置,则默认是黑色线
xAxisLabelColor: '#8A8A8F', //x label的字体颜色,如果不设置,则默认是黑色字体颜色
yAxisColor: '#ffffff', //y轴线的颜色,如果不设置,则默认是黑色线
yAxisLabelColor: '#8A8A8F', // label的字体颜色,如果不设置,则默认是黑色字体颜色
background: '#ffffff', //不传,则默认使用透明背景
xAxisGridColor: '#ffffff', //x轴上分割线颜色
xAxisGridAlpha: 0.5, //x轴上分割线透明度
granularity: 1.2, //间距本身是自适应的,可以使用该值进行调整间距的比例,比如自适应间距是20px,granularity设置为2的时候,界面显示的间距为 40px
yAxisLabelShow: true, //是否只显示最大最小值,true: 显示y轴值;false: 不显示y轴值;默认true
barSelectIndex: 1,
description: '',
valueTextColor: '#4AD8CB', // 设置值显示文本颜色
valueTextSize: 20, // 设置值显示文本字体大小
legend: {
position: 'TOP_LEFT', //"TOP_LEFT"/"TOP_RIGHT"
orientation: 'HORIZONTAL' //"HORIZONTAL"/"BOTTOM_RIGHT"
},
legendHide: false, //是否需要隐藏legend,默认不隐藏
unit: {
x: '',
y: 'kWh'
}
}
}
},
methods: {}
}
</script>
# Attributes
| Prop | Type | Required | Default | Description |
|---|---|---|---|---|
| data | Object | Y | - | {x: {label: ['数据a', '数据b']} 折线图数据配置项(注 1),注:data需要有一个默认值且不为空,x的label至少需要一个值 |
| style | Object | N | - | {} |
# 参数详情: data (注 1)
| Prop | Type | Required | Default | Description |
|---|---|---|---|---|
| x | Object | Y | {} | x 轴坐标配置 |
| y | Array | Y | [] | y 轴坐标配置 (注2) |
| xAxisColor | string | N | #000000 | x 轴线的颜色 |
| yAxisColor | string | N | #000000 | y轴线的颜色 |
| xAxisLabelColor | string | N | #000000 | x轴的字体颜色 |
| yAxisLabelColor | string | N | #000000 | 轴线的颜色 |
| xAxisGridLine | Boolean | N | true | X轴分割线,iOS上默认关闭,设置是否开启X轴分割线绘制 |
| yAxisGridLine | Boolean | N | true | Y轴分割线,iOS上默认关闭,设置是否开启Y轴分割线绘制 |
| xAxisGridColor | string | N | transparent | x轴上分割线颜色 |
| yAxisGridColor | string | N | transparent | y轴上分割线颜色 |
| xAxisGridAlpha | string | N | - | x轴上分割线透明度 |
| xAxisLabelTextSize | Number | N | 12 | x轴文字大小 |
| isUnEquelDistance | Boolean | N | true | iOS新增不等距属性,默认打开(iOS专用) |
| yAxisLabelShow | Boolean | N | true | 是否只显示最大最小值,true: 显示y轴值;false: 不显示y轴值;默认true |
| background | string | N | transparent | 背景颜色 |
| description | string | N | - | 描述 |
| barSelectIndex | Number | N | - | 当前选中 |
| xAxisYOffset | Number | N | - | x轴文字和x轴的距离 |
| yAxisXOffset | number | N | 0 | y轴与label的间距设置 8.3新增 |
| legend | object | N | `` | 图例设置,如: {"position": "TOP_LEFT", "orientation": "HORIZONTAL"} 见注4 |
| legendHide | boolean | N | false | 是否需要隐藏legend |
| unit | object | N | `` | x,y轴单位,如: {"x": "日期","y": "次数"} |
| signPost | Object | N | {} | 选中滑块配置 见注3 |
| valueTextColor | string | N | `` | 值文本颜色 |
| valueTextSize | number | N | `` | 值文本字体大小 |
| yGraduationLabel | string | N | `` | y轴的刻度单位 |
| yAxisMaximum | Number | N | - | y轴坐标最大值 |
| valueTextSize | String | N | true | - |
| yNumberOfDecimalConfig | Boolean | N | true/false | - |
| yNumberOfDecimal | Number | N | - | - |
| draggingMiniUnit | Number | N | - | - |
| rightDraggingMiniUnit | Number | N | - | - |
| scaleType | Number | N | - | - |
| dragType | Number | N | - | - |
| visibleXRangeMaximum | Number | N | - | - |
| marker | Object | N | {} | 手势点击上去的气泡悬浮框 详见注5 |
# 参数详情: y (注 2)
| Prop | Type | Required | Default | Description |
|---|---|---|---|---|
| value | Array | Y | [] | 当前折线的数值 |
| title | String | N | - | 当前折线title,对应legend |
| color | String | Y | - | 折线颜色 |
| starcolor | String | N | - | 区域背景渐变开始颜色(从下自上) |
| endcolor | String | N | - | 区域背景渐变结束颜色(从下自上) |
| smooth | String | N | 0 | 0直线,1平滑 |
| lineWidth | Number | N | 1 | 折线宽度 |
| lineSidesPointAble | Boolean | N | false | 首尾可以设置是否有端点 |
| lineSidesPointRadius | Number | N | [] | 端点大小,端点的半径值大小,lineSidesPointAble为ture有效 |
| lineSidesPointColor | String | N | [] | 端点颜色,lineSidesPointAble为ture有效 |
| lineDashAble | Boolean | N | false | 曲线的类型可调: 是否使用虚线 |
| isDrawCircles | Boolean | N | false | 是否绘制圆圈 (5.12) |
| isDrawCircleHole | Boolean | N | false | 是否绘制圆内 (5.12) |
| circleRadius | Number | N | false | 圆圈半径 (5.12) |
| circleHoleRadius | Number | N | false | 圆内半径 (5.12) |
| circleHoleColor | String | N | false | 圆圈颜色 (5.12) |
| circleColor | String | N | false | 圆内颜色 (5.12) |
| isDrawHighLightCircles | Boolean | N | fals | e 是否启动点击高亮 (5.12) |
| highLightCircleRadius | Number | N | - | 高亮的圆圈半径设置(5.12) |
| highLightCircleHoleRadius | Number | N | - | 高亮的圆内半径设置 (5.12) |
| highLightCircleOutsideWidth | Number | N | - | 高亮的圆外宽度设置 (5.12) |
| highLightCircleColor | String | N | - | 高亮的圆圈颜色 (5.12) |
| highLightCircleHoleColor | String | N | - | 高亮的圆内颜色 (5.12) |
| highLightCircleOutsideColor | String | N | - | 高亮的圆外颜色设置 (5.12) |
| drawVerticalHighlightIndicatorEnabled | Boolean | N | - | 默认false 是否绘制高亮时的竖线,默认不显示 6.5.1支持 |
| highlightColor | String | N | - | 竖线的颜色 6.5.1支持 |
| highlightLineWidth | Number | N | - | 竖线的宽度 默认0.5 6.5.1支持 |
| highlightLineDashLengths | Array | N | - | 第一位代表实线宽度,第二位代表虚线的宽度6.5.1支持 |
| yMarkerUnit | String | N | - | 当前y显示的单位 |
| yMarkerUnitPosition | Number | N | 0 | 单位在数字哪边,0是默认右侧,1是左侧,如果未配置则取marker里面的 |
# 参数详情: signPost (注 3)
| Prop | Type | Required | Default | Description |
|---|---|---|---|---|
| lineHeight | Number | Y | 1 | 线条的高度 |
| lineColor | String | Y | #000000 | 标签线的颜色 如果不设置,则默认是黑色线 |
| linePointRadius | Number | Y | 10 | 标签线上圆点的半径 |
| lineMarginTop | Number | Y | 1 | 线条距离X轴的距离 |
| lineMarginBottom | Number | Y | 1 | 线条距离下边的距离 |
| cursorColor | Strin | g Y | - | 标签(三角形)的颜色 |
| cursorMarginTop | Number | Y | - | 标签(三角形)距离线条的距离 |
| cursorHigh | Number | Y | - | 标签(三角形)本身高度 |
| cursorMarginBottom | Number | Y | - | 标签(三角形)距离下边的距离 |
| show | Boolean | Y | - | 是否显示底部界面 |
| showType | String | Y | - | 端点的显示样式,支持 all,ends,none 三种模式 |
| isSelectedDisappear | Boolean | Y | - | 是否标签 滑动到的端点消失不见 |
| isSelectedShake | Boolean | Y | - | 选择后是否支持震动,默认不支持,因为震动体验问题,该功能仅ios支持 (5.10) |
# 参数详情, legend(见注4)
| Prop | Type | Required | Default | Description |
|---|---|---|---|---|
| position | String | N | TOP_LEFT | 线条的高度 ('TOP_LEFT'、'TOP_RIGHT') |
| orientation | String | N | HORIZONTAL | 方向:'HORIZONTAL'、'BOTTOM_RIGHT' |
| textColor | String | N | #00ff00 | 图例文字颜色(8.7) |
| textSize | Number | N | 10 | 图例文字大小(8.7) |
| form | String | N | LINE | 图例类型NONE, EMPTY, SQUARE, CIRCLE, LINE(8.7) |
| formSize | NUmber | N | 10 | 图例大小(8.7) |
| formLineWidth | Number | N | 6 | 图例线宽大小(8.7) |
| space | Number | N | 6 | 图例之间的间距(8.7) |
# 参数详情, marker(注5)
| Prop | Type | Required | Default | Description |
|---|---|---|---|---|
| markerShow | Boolean | N | false | 默认为false,不显示maker |
| markerTextColor | String | N | #ffffff | marker的字体颜色 |
| markerColor | String | N | #000000 | marker的背景色 |
| markerTextSize | String | N | 12 | marker的字体大小 |
| markerCornerRadius | String | N | 4 | marker的圆角 |
| markerGraduationLabel | String | N | - | 显示单位 默认为空 |
| markerOffsetY | Number | N | 18 | 垂直间距设置 |
| markerOffsetX | Number | N | 10 | 间距设置 |
| barSelectIndex | Number | N | - | 默认显示选中 |
| markerType | Number | N | - | 需要为1,多曲线才能显示 |
| isMutipleLineMark | Boolean | N | true | |
| highLineDashAble | Boolean | N | true | |
| isVerticalHighlightIndicatorEnabled | Boolean | N | - | |
| isHorizontalHighlightIndicatorEnabled | Boolean | N | - | |
| highLightLineWidth | Number | N | - | |
| highLightColor | String | N | #aaaaaa | |
| markerUnitPosition | Number | N | 0 | 单位在数字哪边,0是默认右侧,1是左侧 |
| detailLabelColor | String | N | 0 | marker上label字体颜色 |