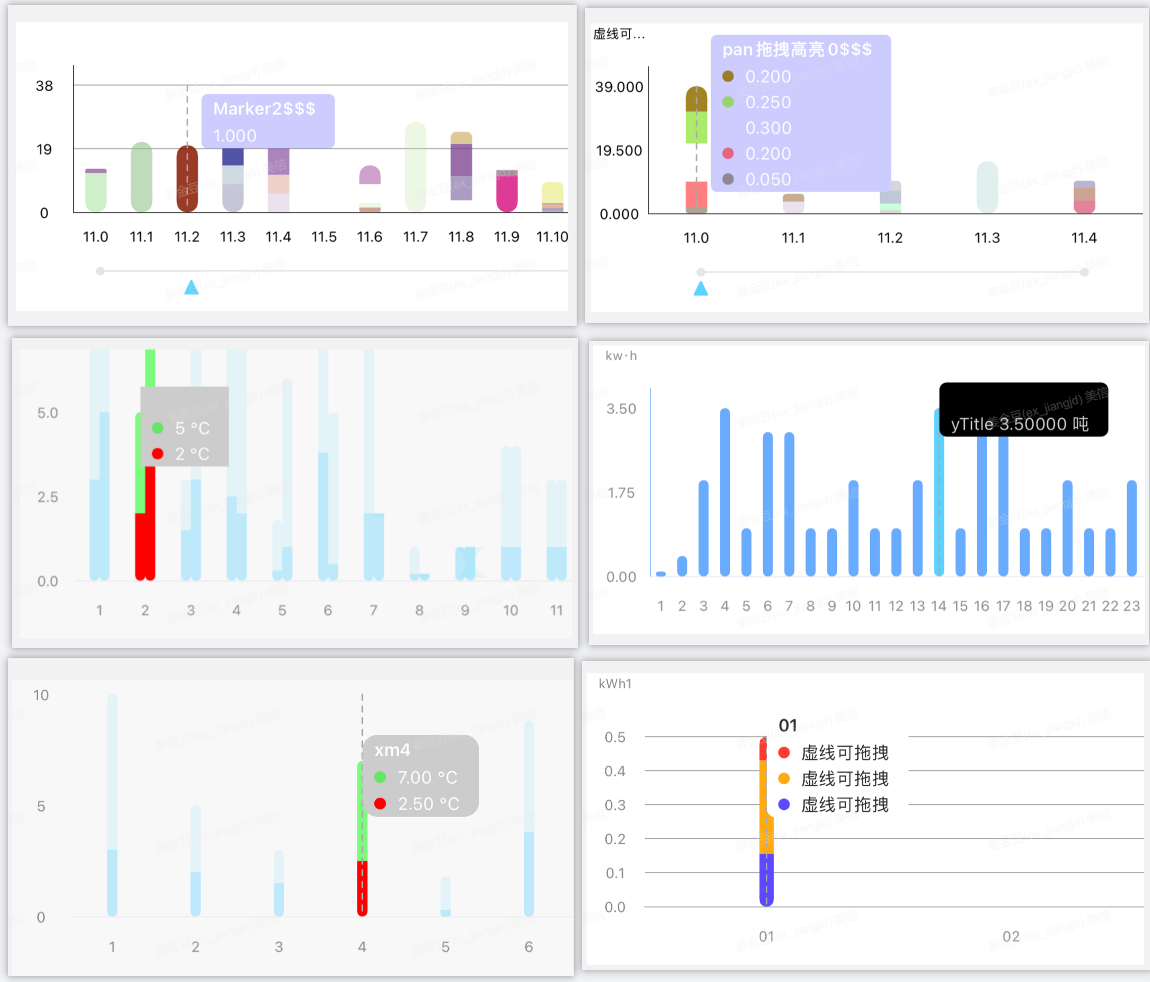
# 6.柱状图(midea-barchart-view)
美居柱形图组件
APP内置组件,可直接在template中使用,不需要import导入和注册 。
# 实例
# 基础用法
<template>
<list class="list">
<cell class="content-wrapper">
<div class="chart-wrapper">
<midea-barchart-view class="barchart1" :data="chartData1"></midea-barchart-view>
</div>
<div class="chart-wrapper">
<midea-barchart-view class="barchart1" :data="chartData_perdrag"></midea-barchart-view>
</div>
<div class="chart-wrapper">
<midea-barchart-view class="barchart1" :data="chartData2"></midea-barchart-view>
</div>
<div class="chart-wrapper">
<midea-barchart-view class="barchart1" :data="chartData3"></midea-barchart-view>
</div>
<div class="chart-wrapper">
<midea-barchart-view class="barchart1" :data="chartData4"></midea-barchart-view>
</div>
<div class="chart-wrapper">
<midea-barchart-view class="barchart1" :data="yPrecisionData"></midea-barchart-view>
</div>
</cell>
</list>
</template>
<style scoped>
.content-wrapper {
align-items: center;
width: 750px;
}
.chart-wrapper {
padding-left: 15px;
padding-right: 15px;
margin-top: 50px;
padding-bottom: 5px;
height: 434px;
background-color: #f2f2f2;
border-radius: 16px;
}
.barchart1-wrapper {
margin-top: 40px;
padding-bottom: 40px;
width: 750px;
height: 434px;
background-color: #ffffff;
border-radius: 16px;
}
.barchart1 {
width: 700px;
height: 366px;
background-color: #f8f8f8;
margin-top: 32px;
}
.barchart2-wrapper {
margin-top: 32px;
width: 750px;
height: 434px;
background-color: #ffffff;
}
.barchart2 {
width: 750px;
height: 366px;
margin-top: 32px;
}
</style>
<script>
const generateSequence = function(dataCount) {
let arr = []
for (let i = 0; i < dataCount; i++) {
arr.push(i)
}
return arr
}
const generateSequenceTxt = function(dataCount, prefix, suffix) {
let arr = []
for (let i = 0; i < dataCount; i++) {
arr.push(prefix + i + suffix)
}
return arr
}
const remainToOne = function(item) {
var proportionSum = 0
var validIdxs = []
for (let i = 0; i < item.length; i++) {
let e = item[i]
if (e.proportion > 0.0 && e.proportion < 1.0) {
validIdxs.push(i)
proportionSum += e.proportion
}
}
return {
diff: 1 - proportionSum,
validIdxs: validIdxs
}
}
const regenerateProportions = function(item, diff, validIdxs) {
var fixItems = []
let appendPropotion = (diff * 1.0) / validIdxs.length
for (let i = 0; i < item.length; i++) {
let e = item[i]
if (validIdxs.indexOf(i) != -1) {
fixItems.push({
proportion: e.proportion + appendPropotion,
color: e.color,
highLightColor: e.highLightColor,
highLightContent: e.highLightContent
})
}
}
return fixItems
}
const renderAttributeFixup = function(raw) {
var updates = []
raw.forEach(e => {
let ret = remainToOne(e)
if (ret.validIdxs.length == 0) {
//所有数据都非法,则只返回一段,并且
updates.push({
proportion: 1,
color: e.color,
highLightColor: e.highLightColor,
highLightContent: e.highLightContent
})
} else if (ret.diff > 0) {
updates.push(regenerateProportions(e, ret.diff, ret.validIdxs))
} else {
updates.push(e)
}
})
return updates
}
const randomNum = function(dataCount) {
let arr = []
for (let i = 0; i < dataCount; i++) {
var random = Math.floor(Math.random() * 40)
if (i < 0) {
arr.push(0)
} else {
arr.push(random)
}
}
return arr
}
const getAppropriateProportion = function() {
let v = Math.ceil((Math.random() * 10000) % 6)
v *= 0.1
return v
}
const getRandomProportion = function(n) {
var arr = []
//最后一个元素不填充
let p = n - 1
for (let i = 0; i < p; i++) {
//至少大于0.1
let v = getAppropriateProportion()
console.log('n:' + n + ' v:' + v)
arr.push(v)
}
var proceed = true
let modifyIdx = 0
while (proceed) {
let presum = 0
for (let i = 0; i < p; i++) {
presum += arr[i]
}
console.log('presum:' + presum + ' modifyIdx: ' + modifyIdx)
if (presum > 1.0) {
if (modifyIdx >= p) {
modifyIdx = 0
}
if (arr[modifyIdx] - 0.4 > 0) {
arr[modifyIdx] -= 0.2
} else {
arr[modifyIdx] = getAppropriateProportion() * 0.5
}
modifyIdx += 1
} else {
arr[p] = 1 - presum
proceed = false
}
}
var newSum = 0
for (let i = 0; i < n; i++) {
newSum += arr[i]
}
console.log(n + ' partial 😄, ' + 'arr ==>' + arr + ' newSum: ' + newSum)
return arr
}
const randomAttribute = function(dataCount) {
let arr = []
for (let i = 0; i < dataCount; i++) {
let random = Math.random() * 40
//随机生成n 1<= n <= 6
let n = Math.floor(((Math.random() * 100) % 6) + 1)
let partialArray = []
var proportions = getRandomProportion(n)
for (let j = 0; j < n; j++) {
let rcolors = [
'#00FF00',
'#6B238E',
'#32CD99',
'#5959AB',
'#0000FF',
'#2F4F4F',
'#3232CD',
'#6F4242',
'#FF00FF',
'#97694F',
'#6B8E23',
'#BC1717',
'#00FFFF',
'#7093DB',
'#EAEAAE',
'#238E68',
'#FFFF00',
'#855E42',
'#9370DB',
'#6B4226',
'#000000',
'#545454',
'#426F42',
'#8E6B23',
'#70DB93',
'#856363',
'#7F00FF',
'#E6E8FA',
'#5C3317',
'#D19275',
'#7FFF00',
'#3299CC',
'#9F5F9F',
'#8E2323',
'#70DBDB',
'#007FFF',
'#B5A642',
'#238E23',
'#DB7093',
'#FF1CAE',
'#D9D919',
'#CD7F32',
'#A68064',
'#00FF7F',
'#A67D3D',
'#DBDB70',
'#2F2F4F',
'#236B8E',
'#8C7853',
'#C0C0C0',
'#23238E',
'#38B0DE',
'#A67D3D',
'#527F76',
'#4D4DFF',
'#DB9370',
'#5F9F9F',
'#93DB70',
'#FF6EC7',
'#D8BFD8',
'#D98719',
'#215E21',
'#00009C',
'#ADEAEA',
'#B87333',
'#4E2F2F',
'#EBC79E',
'#5C4033',
'#FF7F00',
'#9F9F5F',
'#CFB53B',
'#CDCDCD',
'#42426F',
'#C0D9D9',
'#FF7F00',
'#4F2F4F',
'#5C4033',
'#A8A8A8',
'#FF2400',
'#CC3299',
'#2F4F2F',
'#8F8FBD',
'#DB70DB',
'#D8D8BF',
'#4A766E',
'#E9C2A6',
'#8FBC8F',
'#99CC32'
]
let rawc = rcolors[Math.floor((Math.random() * 10000) % (rcolors.length - 2))]
let r1 = rawc + '88'
let r2 = rawc + '00'
let item = {
proportion: proportions[j],
color: r1,
highLightColor: r2,
highLightContent: proportions[j].toFixed(3) + ''
}
partialArray.push(item)
}
arr.push(partialArray)
}
return arr
}
const multiplyColorXCount = 40
const mulColorXvalue = generateSequence(multiplyColorXCount)
const mulColorXLabels = generateSequenceTxt(multiplyColorXCount, '11.', '')
const mulColorYvalue = randomNum(multiplyColorXCount)
const mulColorAttributes = randomAttribute(multiplyColorXCount)
const mulColorMarkerLabels = generateSequenceTxt(multiplyColorXCount, 'Marker', '$$$')
const multiplyColorXCount_perdrag = 5
const mulColorXvalue_perdrag = generateSequence(multiplyColorXCount_perdrag)
const mulColorXLabels_perdrag = generateSequenceTxt(multiplyColorXCount_perdrag, '11.', '')
const mulColorYvalue_perdrag = randomNum(multiplyColorXCount_perdrag)
const mulColorAttributes_perdrag = randomAttribute(multiplyColorXCount_perdrag)
const mulColorMarkerLabels_perdrag = generateSequenceTxt(multiplyColorXCount_perdrag, 'pan拖拽高亮', '$$$')
export default {
created() {},
data() {
return {
chartData1: {
yAxisGridLine: true,
marker: {
//ChartMarkerView
// extraInfo: {
// title: '行2',
// value: ['exv1', 'exv2', 'exv3']
// },
markerShow: true, //默认为false,不显示maker
markerColor: '#ccccff', //默认为黑色000000,marker的背景色
markerTextColor: '#ffffff', //默认白色,marker字体字颜色
markerTextSize: '12', //默认12
markerCornerRadius: '4', //圆角
markerGraduationLabel: '℃', //显示单位 默认为空""
markerOffsetY: 18, //垂直间距设置
markerOffsetX: 10,
barSelectIndex: 1,
markerType: 1, //需要为1,多曲线才能显示
isMutipleLineMark: true,
highLineDashAble: true,
isVerticalHighlightIndicatorEnabled: true,
isHorizontalHighlightIndicatorEnabled: false,
highLightColor: '#aaaaaa',
highLightLineWidth: 1
},
x: {
value: mulColorXvalue,
label: mulColorXLabels,
markerLabel: mulColorMarkerLabels
},
y: [
{
//"maxValue": [4, 6, 8, 10, 2, 5, 8],
value: mulColorYvalue,
renderAttributes: mulColorAttributes,
background: '#ffffff',
//"maxHighLightColor": "#805BD2FF", //高亮颜色
//"highLightColor": "#FF5BD2FF", //高亮颜色
highLightEnable: true //点击高亮是否可用
}
],
xAxisColor: '#000000', //x轴线的颜色,如果不设置,则默认是黑色线
xAxisLabelColor: '#000000', //x label的字体颜色,如果不设置,则默认是黑色字体颜色
yAxisColor: '#000000', //y轴线的颜色,如果不设置,则默认是黑色线
yAxisLabelColor: '#000000', // label的字体颜色,如果不设置,则默认是黑色字体颜色
background: '#ffffff', //不传,则默认使用透明背景
borderRadius: '7.5', //柱子顶部的圆角,默认为0px
bottomBorderRadius: '7.5', //底部的圆角值
barWidth: '15', //设置柱状的宽度
barSpacing: 17,
xAxisGridColor: '#ffffff', //x轴上分割线颜色
xAxisGridAlpha: 0.5, //x轴上分割线透明度
granularity: 1.2, //间距本身是自适应的,可以使用该值进行调整间距的比例,比如自适应间距是20px,granularity设置为2的时候,界面显示的间距为 40px
barSelectIndex: 2,
yAxisLabelShow: true, //是否只显示最大最小值,true: 显示y轴值;false: 不显示y轴值;默认true
description: '',
legend: {
position: 'TOP_RIGHT', //"TOP_LEFT"/"TOP_RIGHT"
orientation: 'BOTTOM_RIGHT', //"HORIZONTAL"/"BOTTOM_RIGHT"
show: false //控制每组数据标识的显示或隐藏
},
unit: {
// "x": "x坐标",
y: ''
},
signPost: {
//底部界面 v5.8.0
lineHeight: 1, //线条的高度
lineColor: '#e5e5e8', //标签线的颜色 如果不设置,则默认是黑色线
linePointRadius: 3, //标签线上圆点的半径, 默认10
lineMarginTop: '5', //线条距离X轴的距离
lineMarginBottom: '0',
cursorColor: '#5BD2FF', //标签(三角形)的颜色 如果不设置,则默认是黑色线
cursorMarginTop: '5', //标签(三角形)距离线条的距离
cursorHigh: '20', //标签(三角形)本身高度
cursorMarginBottom: '0',
show: true, //默认是 false 是否显示底部界面
showType: 'ends', //端点的显示样式,支持 all,ends,none 三种模式
isSelectedDisappear: true //是否标签 滑动到的端点消失不见
},
yNumberOfDecimalConfig: true,
yNumberOfDecimal: 3
},
chartData_perdrag: {
optimizeHighlightPerDrag: false,
marker: {
//ChartMarkerView
// extraInfo: {
// title: '行2',
// value: ['exv1', 'exv2', 'exv3']
// },
markerShow: true, //默认为false,不显示maker
markerColor: '#ccccff', //默认为黑色000000,marker的背景色
markerTextColor: '#ffffff', //默认白色,marker字体字颜色
markerTextSize: '12', //默认12
markerCornerRadius: '4', //圆角
markerGraduationLabel: '℃', //显示单位 默认为空""
markerOffsetY: 18, //垂直间距设置
markerOffsetX: 10,
barSelectIndex: 1,
markerType: 1, //需要为1,多曲线才能显示
isMutipleLineMark: true,
highLineDashAble: true,
isVerticalHighlightIndicatorEnabled: true,
isHorizontalHighlightIndicatorEnabled: false,
highLightColor: '#aaaaaa',
highLightLineWidth: 1
},
x: {
value: mulColorXvalue_perdrag,
label: mulColorXLabels_perdrag,
markerLabel: mulColorMarkerLabels_perdrag
},
y: [
{
//"maxValue": [4, 6, 8, 10, 2, 5, 8],
value: mulColorYvalue_perdrag,
renderAttributes: mulColorAttributes_perdrag,
background: '#ffffff',
//"maxHighLightColor": "#805BD2FF", //高亮颜色
//"highLightColor": "#FF5BD2FF", //高亮颜色
highLightEnable: true //点击高亮是否可用
}
],
xAxisColor: '#000000', //x轴线的颜色,如果不设置,则默认是黑色线
xAxisLabelColor: '#000000', //x label的字体颜色,如果不设置,则默认是黑色字体颜色
yAxisColor: '#000000', //y轴线的颜色,如果不设置,则默认是黑色线
yAxisLabelColor: '#000000', // label的字体颜色,如果不设置,则默认是黑色字体颜色
background: '#ffffff', //不传,则默认使用透明背景
borderRadius: '7.5', //柱子顶部的圆角,默认为0px
bottomBorderRadius: '7.5', //底部的圆角值
barWidth: '15', //设置柱状的宽度
barSpacing: 17,
xAxisGridColor: '#ffffff', //x轴上分割线颜色
xAxisGridAlpha: 0.5, //x轴上分割线透明度
granularity: 1.2, //间距本身是自适应的,可以使用该值进行调整间距的比例,比如自适应间距是20px,granularity设置为2的时候,界面显示的间距为 40px
barSelectIndex: 2,
yAxisLabelShow: true, //是否只显示最大最小值,true: 显示y轴值;false: 不显示y轴值;默认true
description: '',
legend: {
position: 'TOP_RIGHT', //"TOP_LEFT"/"TOP_RIGHT"
orientation: 'BOTTOM_RIGHT', //"HORIZONTAL"/"BOTTOM_RIGHT"
show: false //控制每组数据标识的显示或隐藏
},
unit: {
// "x": "x坐标",
y: '虚线可拖拽'
},
signPost: {
//底部界面 v5.8.0
lineHeight: 1, //线条的高度
lineColor: '#e5e5e8', //标签线的颜色 如果不设置,则默认是黑色线
linePointRadius: 3, //标签线上圆点的半径, 默认10
lineMarginTop: '5', //线条距离X轴的距离
lineMarginBottom: '0',
cursorColor: '#5BD2FF', //标签(三角形)的颜色 如果不设置,则默认是黑色线
cursorMarginTop: '5', //标签(三角形)距离线条的距离
cursorHigh: '20', //标签(三角形)本身高度
cursorMarginBottom: '0',
show: true, //默认是 false 是否显示底部界面
showType: 'ends', //端点的显示样式,支持 all,ends,none 三种模式
isSelectedDisappear: true //是否标签 滑动到的端点消失不见
},
yNumberOfDecimalConfig: true,
yNumberOfDecimal: 3
},
chartData2: {
marker: {
//ChartMarkerView
// extraInfo: {
// title: '行2',
// value: ['exv1', 'exv2', 'exv3']
// },
markerShow: true, //默认为false,不显示maker
markerColor: '#cccccc', //默认为黑色,marker的背景色
markerTextColor: '#ffffff', //默认白色,marker字体字颜色
markerTextSize: '12', //默认12
markerCornerRadius: '10', //圆角
markerGraduationLabel: '℃', //显示单位 默认为空""
markerOffsetY: 0, //垂直间距设置
markerType: 1, //需要为1,多曲线才能显示
isMutipleLineMark: true,
highLineDashAble: true,
isVerticalHighlightIndicatorEnabled: true,
isHorizontalHighlightIndicatorEnabled: false,
highLightColor: '#aaaaaa',
markermaximumFractionDigits: 2,
trimSuffixFragction: false
},
barTouchTop: true,
x: {
markerLabel: ['xm1', 'xm2', 'xm3', 'xm4', 'xm5', 'xm6', 'xm7', 'xm8', 'xmarkerLabel9111111'],
label: [
'1',
'2',
'3',
'4',
'5',
'6',
'7',
'8',
'9',
'10',
'11',
'12',
'13',
'14',
'15',
'16',
'17',
'18',
'19',
'20',
'21',
'22',
'23',
'24',
'25',
'26',
'27',
'28',
'29',
'30'
]
},
y: [
{
maxValue: [
10,
5,
3,
7,
1.8,
8.8,
9,
1,
1,
4,
3,
7,
4,
8.5,
7,
9,
8.6,
1.8,
3,
4,
10,
8,
7,
3,
3.8,
3.6,
4,
7,
4,
4
],
value: [
3,
2,
1.5,
2.5,
0.3,
3.8,
2,
0.2,
1,
1,
1,
3,
1,
0.5,
3.2,
2,
2,
0.5,
1,
1,
3,
2,
2,
0.5,
0.8,
1.1,
1,
1,
1,
1
],
// "label": ["7L", "3L", "2.5L", "4.5L", "1.5L", "5L", "7L", "0.8L", "1L", "3L", "2L", "4L", "3L", "8L", "3.8L", "7L", "6.6L", "1.3L", "2L", "3L", "7L", "6L", "5L", "2.5L", "3L", "2.5L", "3L", "6L", "3L", "3L"],
color: '#605BD2FF', //柱子颜色ARGB格式
maxColor: '#205BD2FF', //柱子上面颜色ARGB格式
maxHighLightColor: '#8000FF00', //高亮颜色
highLightColor: '#FFFF0000', //高亮颜色
background: '#ffffff',
highLightEnable: true //点击高亮是否可用
}
],
xAxisColor: '#e5e5e8', //x轴线的颜色,如果不设置,则默认是白色线
xAxisLabelColor: '#8a8a8f', //x label的字体颜色,如果不设置,则默认是白色线
yAxisColor: 'transparent', //y轴线的颜色,如果不设置,则默认是白色线
yAxisLabelColor: '#8a8a8f', // label的字体颜色,如果不设置,则默认是白色线
// "background": "#ffffff", //不传,则默认使用透明背景
borderRadius: '3', //柱子顶部的圆角,默认为0px
bottomBorderRadius: '3', //底部的圆角值
barWidth: 5, //设置柱状的宽度
description: '图标描叙',
valueTextColor: '#4AD8CB', // 设置值显示文本颜色
valueTextSize: 12, // 设置值显示文本字体大小
barSpacing: 50,
barSelectIndex: 12,
title: 't室1',
legend: {
position: 'TOP_RIGHT', //"TOP_LEFT"/"TOP_RIGHT"
orientation: 'BOTTOM_RIGHT', //"HORIZONTAL"/"BOTTOM_RIGHT"
show: false //是否显示标识
},
unit: {
// "x": "x坐标",
// "y": "y坐标"
}
},
chartData3: {
marker: {
//ChartMarkerView
// extraInfo: {
// title: '行2',
// value: ['exv1', 'exv2', 'exv3']
// },
markerShow: true, //默认为false,不显示maker
markerColor: '#000000', //默认为黑色,marker的背景色
markerTextColor: '#cccccc', //默认白色,marker字体字颜色
markerTextSize: '12', //默认12
markerCornerRadius: '5', //圆角
markerGraduationLabel: '吨', //显示单位 默认为空""
markerOffsetY: 0, //垂直间距设置
barSelectIndex: 1,
markerType: 1, //需要为1,多曲线才能显示
isMutipleLineMark: true,
highLineDashAble: true,
isVerticalHighlightIndicatorEnabled: true,
isHorizontalHighlightIndicatorEnabled: false,
highLightColor: '#aaaaaa',
markermaximumFractionDigits: 5,
trimSuffixFragction: false
},
description: '图标描叙',
unit: { y: 'kw·h' },
yAxisLabelColor: '#8a8a8f',
xAxisColor: '#e5e5e8',
background: '#ffffff',
x: {
markerLabel: ['xmarkerLabel9111111', 'xm2', 'xm3', 'xm4', 'xm5', 'xm6', 'xm7', 'xm8', 'xmarkerLabel9111111'],
label: [
1,
2,
3,
4,
5,
6,
7,
8,
9,
10,
11,
12,
13,
14,
15,
16,
17,
18,
19,
20,
21,
22,
23,
24,
25,
26,
27,
28,
29,
30
]
},
yAxisColor: '#FF69ABFF',
y: [
{
maxColor: '#FF69ABFF',
color: '#FF69ABFF',
highLightColor: '#FF5BD2FF',
value: [
0.1,
0.4234,
2,
3.5,
1,
3,
3,
1,
1,
2,
1,
1,
2,
3.5,
1,
3,
3,
1,
1,
2,
1,
1,
2,
3.5,
1,
3,
3,
1,
1,
2
],
background: '#ffffff',
highLightEnable: true,
maxHighLightColor: '#805BD2FF',
title: 'yTitle'
}
],
barWidth: '6',
barSpacing: '8',
bottomBorderRadius: '3',
yAxis: [{ position: 'RIGHT' }],
legend: {
show: false,
position: 'TOP_LEFT',
orientation: 'BOTTOM_RIGHT'
},
borderRadius: '3',
xAxisLabelColor: '#8a8a8f'
},
chartData4: {
marker: {
//ChartMarkerView
// extraInfo: {
// title: '行2',
// value: ['exv1', 'exv2', 'exv3']
// },
markerShow: true, //默认为false,不显示maker
markerColor: '#cccccc', //默认为黑色,marker的背景色
markerTextColor: '#ffffff', //默认白色,marker字体字颜色
markerTextSize: '12', //默认12
markerCornerRadius: '0', //圆角
markerGraduationLabel: '℃', //显示单位 默认为空""
markerOffsetY: 0, //垂直间距设置
markerOffsetX: 0, //垂直间距设置
barSelectIndex: 1,
markerType: 1, //需要为1,多曲线才能显示
isMutipleLineMark: true
},
x: {
//"value": [1, 2, 3, 4, 5, 6, 7],
label: [
1,
2,
3,
4,
5,
6,
7,
8,
9,
10,
11,
12,
13,
14,
15,
16,
17,
18,
19,
20,
21,
22,
23,
24,
25,
26,
27,
28,
29,
30
]
},
y: [
{
maxValue: [
10,
5,
3,
7,
1.8,
8.8,
9,
1,
1,
4,
3,
7,
4,
8.5,
7,
9,
8.6,
1.8,
3,
4,
10,
8,
7,
3,
3.8,
3.6,
4,
7,
4,
4
],
value: [
3,
2,
1.5,
2.5,
0.3,
3.8,
2,
0.2,
1,
1,
1,
3,
1,
0.5,
3.2,
2,
2,
0.5,
1,
1,
3,
2,
2,
0.5,
0.8,
1.1,
1,
1,
1,
1
],
// "label": ["7L", "3L", "2.5L", "4.5L", "1.5L", "5L", "7L", "0.8L", "1L", "3L", "2L", "4L", "3L", "8L", "3.8L", "7L", "6.6L", "1.3L", "2L", "3L", "7L", "6L", "5L", "2.5L", "3L", "2.5L", "3L", "6L", "3L", "3L"],
color: '#605BD2FF', //柱子颜色ARGB格式
maxColor: '#205BD2FF', //柱子上面颜色ARGB格式
maxHighLightColor: '#8000FF00', //高亮颜色
highLightColor: '#FFFF0000', //高亮颜色
background: '#ffffff',
highLightEnable: true //点击高亮是否可用
},
{
maxValue: [
10,
9,
8,
7,
6,
5,
1.9,
0.1,
0.1,
4,
3,
7,
4,
8.5,
7,
9,
8.6,
1.8,
3,
4,
10,
8,
7,
3,
3.8,
3.6,
4,
7,
4,
4
],
value: [
5,
4,
3,
2,
1,
0.5,
2,
0.2,
1,
1,
1,
3,
1,
0.5,
3.2,
2,
2,
0.5,
1,
1,
3,
2,
2,
0.5,
0.8,
1.1,
1,
1,
1,
1
],
// "label": ["7L", "3L", "2.5L", "4.5L", "1.5L", "5L", "7L", "0.8L", "1L", "3L", "2L", "4L", "3L", "8L", "3.8L", "7L", "6.6L", "1.3L", "2L", "3L", "7L", "6L", "5L", "2.5L", "3L", "2.5L", "3L", "6L", "3L", "3L"],
color: '#605BD2FF', //柱子颜色ARGB格式
maxColor: '#205BD2FF', //柱子上面颜色ARGB格式
maxHighLightColor: '#8000FF00', //高亮颜色
highLightColor: '#FFFF0000', //高亮颜色
background: '#ffffff',
highLightEnable: true //点击高亮是否可用
}
],
xAxisColor: '#e5e5e8', //x轴线的颜色,如果不设置,则默认是白色线
xAxisLabelColor: '#8a8a8f', //x label的字体颜色,如果不设置,则默认是白色线
yAxisColor: 'transparent', //y轴线的颜色,如果不设置,则默认是白色线
yAxisLabelColor: '#8a8a8f', // label的字体颜色,如果不设置,则默认是白色线
// "background": "#ffffff", //不传,则默认使用透明背景
borderRadius: '3', //柱子顶部的圆角,默认为0px
bottomBorderRadius: '3', //底部的圆角值
barWidth: '3', //设置柱状的宽度
description: '图标描叙',
valueTextColor: '#4AD8CB', // 设置值显示文本颜色
valueTextSize: 12, // 设置值显示文本字体大小
barSpacing: '18',
title: 't室1',
legend: {
position: 'TOP_RIGHT', //"TOP_LEFT"/"TOP_RIGHT"
orientation: 'BOTTOM_RIGHT', //"HORIZONTAL"/"BOTTOM_RIGHT"
show: false //是否显示标识
},
unit: {
// "x": "x坐标",
// "y": "y坐标"
}
},
yPrecisionData: {
optimizeHighlightPerDrag: false,
marker: {
markerShow: true,
markerColor: '#ffffff',
markerTextColor: '##2D2D2D',
markerTextSize: '12',
markerCornerRadius: 6,
markerGraduationLabel: '',
markerOffsetY: 0,
barSelectIndex: 1,
markerType: 1,
isMutipleLineMark: true,
highLineDashAble: true,
isVerticalHighlightIndicatorEnabled: true,
isHorizontalHighlightIndicatorEnabled: false,
highLightColor: '#aaaaaa',
showYTitle: false
},
x: { value: ['01', '02'], label: ['01', '02'], markerLabel: ['01', '02'] },
y: [
{
value: [0.5, 0],
renderAttributes: renderAttributeFixup([
[
{ proportion: 0.14, color: '#FF3B30', highLightColor: '#FF3B30', highLightContent: '虚线可拖拽' },
{ proportion: 0.55, color: '#FFAA10', highLightColor: '#FFAA10', highLightContent: '虚线可拖拽' },
{ proportion: 0.31, color: '#5D49FF', highLightColor: '#5D49FF', highLightContent: '虚线可拖拽' }
],
[
{ proportion: 0.2, color: '#FF3B30', highLightColor: '#FF3B30', highLightContent: '虚线可拖拽' },
{ proportion: 0.53, color: '#FFAA10', highLightColor: '#FFAA10', highLightContent: '虚线可拖拽' },
{ proportion: -0.27, color: '#5D49FF', highLightColor: '#5D49FF', highLightContent: '虚线可拖拽' }
]
]),
background: '#ffffff',
highLightEnable: true
}
],
xAxisColor: '#8A8A8F',
xAxisLabelColor: '#8A8A8F',
yAxisColor: '#ffffff',
yAxisLabelColor: '#8A8A8F',
xAxisGridLine: false,
yAxisGridLine: true,
axisGridColor: '#8A8A8F',
yAxisLabelCount: 6,
yNumberOfDecimalConfig: true,
yNumberOfDecimal: 1,
background: '#ffffff',
borderRadius: 6,
bottomBorderRadius: 6,
barSpacing: '26',
barWidth: '10',
xAxisGridColor: '#ffffff',
xAxisGridAlpha: 0.5,
granularity: 1.2,
yAxisLabelShow: true,
description: '',
legend: { position: 'TOP_RIGHT', orientation: 'BOTTOM_RIGHT', show: false },
unit: { x: '', y: 'kWh1' },
signPost: {}
},
}
},
methods: {}
}
</script>
# Attributes
| Prop | Type | Required | Default | Description |
|---|---|---|---|---|
| data | Object | Y | {} | 柱状图数据配置项,详见注1 |
# 参数详情:data注1
| Prop | Type | Required | Default | Description |
|---|---|---|---|---|
| x | Object | Y | {} | x坐标轴标识配置 详见注2 |
| y | Array | Y | [] | y坐标轴标识配置 如单位、颜色等属性 详见注3 |
| yAxisMaximum | Number | N | - | y轴坐标最大值 |
| marker | Object | N | {} | 手势点击上去的气泡悬浮框 详见注4 |
| xAxisColor | String | N | - | x轴线的颜色,如果不设置,则默认是白色线 |
| xAxisLabelColor | String | N | - | x label的字体颜色,如果不设置,则默认是白色线 |
| yAxisColor | String | N | - | y轴线的颜色,如果不设置,则默认是白色线 |
| yAxisLabelColor | String | N | - | y label的字体颜色,如果不设置,则默认是白色线 |
| background | String | N | transparent | 不传,则默认使用透明背景 |
| borderRadius | Number | N | - | 圆角 |
| barSpacing | Number | N | - | 设置柱状图最小间距。间距默认为控件宽度/(柱状个数 * 2 + 1),如果默认间距小于最小间距,则使用最小间距。 |
| barWidth | Number | N | - | 设置柱状的宽度 |
| overMaxValueBarColor | String | N | - | 超过最大值时柱子的颜色, v7.10新增支持 |
| description | String | N | - | 图表描述 |
| legend | Number | N | - | 数据标识配置 |
| unit | Object | N | - | 坐标轴字体大小和预留边距配置 详见注5 |
| bottomBorderRadius | Number | N | - | 底部的圆角值, 注意:borderRadius 和bottomBorderRadius 如果底部和顶部圆角同时存在,大小必须一致 |
| signPost | Object | N | - | 标签配置 注6 |
| yAxisGridLine | Boolean | N | true | 是否显示Y轴上的水平线 |
| xAxisGridLine | Boolean | N | true | 是否显示X轴上的水平线 |
| axisGridColor | String | N | - | X/Y轴上的水平/竖直方向线颜色 |
| xAxisLabelHighLightColor | String | N | - | x轴刻度选择后颜色 |
| xAxisLabelHighLightThicke | Boolean | N | - | x轴刻度选择后字体是否加粗 |
| yGraduationLabel | String | Y | - | y轴的刻度单位 如M,L,CM等 |
| barSelectIndex | Number | N | - | 选中Bar的index(从0开始),默认没有选中态 |
| yAxisLabelEnable | Boolean | N | true | 默认为true,设置 false后y轴label 不占据任何空间 |
| valueTextColor | String | N | true | 文本的颜色 |
| valueTextSize | String | N | true | - |
| yNumberOfDecimalConfig | Boolean | N | true/false | - |
| yNumberOfDecimal | Number | N | - | - |
| draggingMiniUnit | Number | N | - | - |
| rightDraggingMiniUnit | Number | N | - | - |
| scaleType | Number | N | - | - |
| dragType | Number | N | - | - |
| visibleXRangeMaximum | Number | N | - | - |
# 参数详情:x 注2
| Prop | Type | Required | Default | Description |
|---|---|---|---|---|
| value | Array | N | [] | x的值 |
| label | Array | N | [] | x轴展示的文本 |
| markerLabel | Array | N | [] | 鼠标悬浮时x的气泡展示 |
# 参数详情:y 注3
| Prop | Type | Required | Default | Description |
|---|---|---|---|---|
| maxValue | Array | N | - | 最大高度 |
| value | Array | Y | - | 具体高度 |
| renderAttributes | Array | N | - | 支持多个不同颜色柱子 |
| background | String | N | - | 背景色 |
| maxHighLightColor | String | N | - | 高亮颜色 |
| highLightColor | String | N | - | 高亮颜色 |
| highLightEnable | Boolean | N | - | 点击高亮是否可用 |
# 参数详情:marker 注4
| Prop | Type | Required | Default | Description |
|---|---|---|---|---|
| markerShow | Boolean | N | false | 默认为false,不显示maker |
| markerTextColor | String | N | #ffffff | marker的字体颜色 |
| markerColor | String | N | #000000 | marker的背景色 |
| markerTextSize | String | N | 12 | marker的字体大小 |
| markerCornerRadius | String | N | 4 | marker的圆角 |
| markerGraduationLabel | String | N | - | 显示单位 默认为空 |
| markerOffsetY | Number | N | 18 | 垂直间距设置 |
| markerOffsetX | Number | N | 10 | 间距设置 |
| barSelectIndex | Number | N | - | 默认显示选中 |
| markerType | Number | N | - | 需要为1,多曲线才能显示 |
| isMutipleLineMark | Boolean | N | true | |
| highLineDashAble | Boolean | N | true | |
| isVerticalHighlightIndicatorEnabled | Boolean | N | - | |
| isHorizontalHighlightIndicatorEnabled | Boolean | N | - | |
| highLightLineWidth | Number | N | - | |
| highLightColor | String | N | #aaaaaa | |
| markerUnitPosition | Number | N | 0 | 单位在数字哪边,0是默认右侧,1是左侧 |
# 参数详情:unit 注5
| Prop | Type | Required | Default | Description |
|---|---|---|---|---|
| x | String | N | - | x轴顶端的单位 |
| y | String | N | - | y轴顶端的单位 |
# 参数详情:signPost 注6
| Prop | Type | Required | Default | Description |
|---|---|---|---|---|
| show | Boolean | N | - | 默认是 false 是否显示底部界面 |
| lineHeight | String | N | - | 线条的高度 |
| lineColor | String | N | - | 标签线的颜色 如果不设置,则默认是黑色线 |
| linePointRadius | Number | N | - | 标签线上圆点的半径, 默认10 |
| lineMarginTop | String | N | - | 线条距离X轴的距离 |
| lineMarginBottom | String | N | - | 线条距离X轴的距离 |
| cursorColor | String | N | #5BD2FF | 标签(三角形)的颜色 如果不设置,则默认是黑色线 |
| cursorMarginTop | String | N | - | 标签(三角形)距离线条的距离 |
| cursorHigh | String | N | - | 标签(三角形)本身高度 |
| cursorMarginBottom | String | N | - | 标签(三角形)本身高度 |
| showType | String | N | ends | 端点的显示样式,支持 all,ends,none 三种模式 |
| isSelectedDisappear | Boolean | N | - | 是否标签 滑动到的端点消失不见 |
# Events
| 事件名称 | 说明 | 回调参数 |
|---|---|---|
| barClicked | 点击柱状图柱子回调 | event |