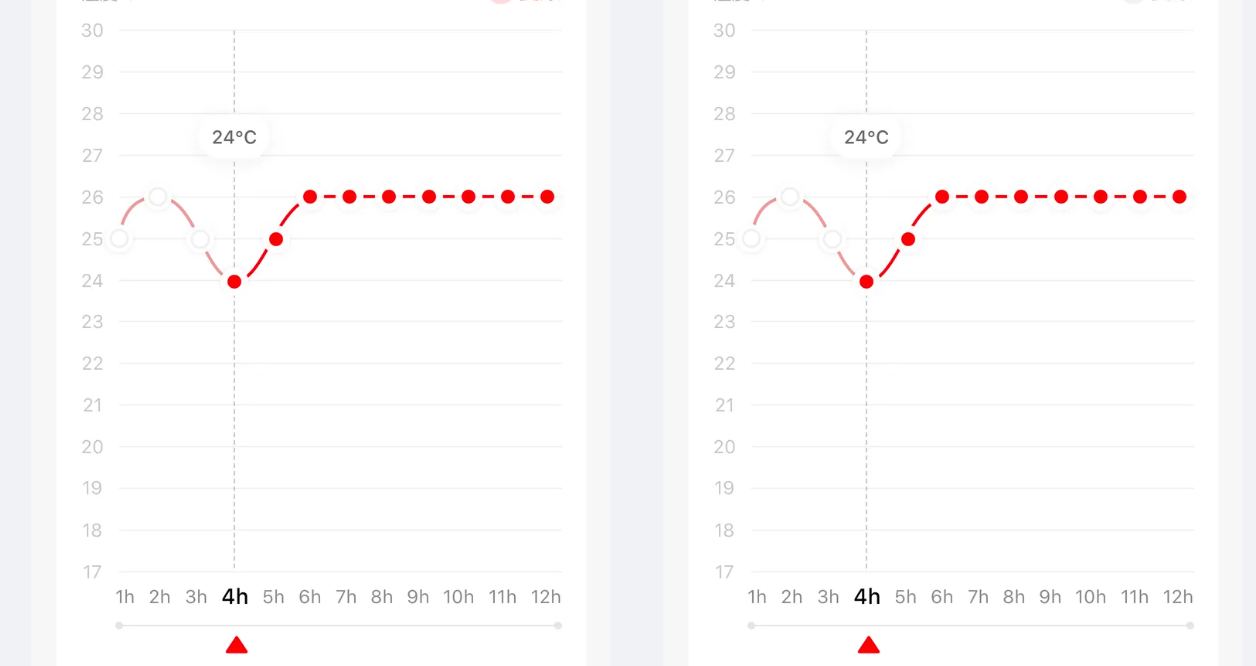
# 11.可拖拽折线图(midea-dragging-linechart-view)
折线图组件,折线图中的坐标点可以拖拽
# 实例

# 基础用法
<template>

    <midea-dragging-linechart-view
      class="linechart"
      :data="chartJson"
      @onLineDrag="onLineDrag"
    ></midea-dragging-linechart-view>

</template>
<script>
export default {
    data() {
        return {
            chartJson: {
                x: {
                    value: [1,2,3],
                    label: ['1','2','3']
                },
                y: [
                    {
                        value: [28,28,28], // 只有首次请求才没有数据
                        color: '#e61e1e', //折线颜色
                        // starcolor: '#ffffff', //区域背景渐变开始颜色(从下自上)
                        // endcolor: '#00ccb8', //区域背景渐变结束颜色(从下自上)
                        smooth: 1, //0直线,1平滑

                        isDrawCircles: true, //是否绘制圆圈  (5.12)
                        isDrawCircleHole: false, //是否绘制圆内  (5.12)
                        circleRadius: 12, //圆圈半径  (5.12)
                        circleHoleRadius: 12, //圆内半径  (5.12)
                        circleHoleColor: '#FFFFFF', //圆圈颜色  (5.12)
                        circleColor: '#FFFFFF', //圆内颜色  (5.12)

                        //点中高亮的设置
                        isDrawHighLightCircles: false, //是否启动 点击高亮 (5.12)
                        highLightCircleRadius: 8, // 高亮的圆圈半径设置(5.12)
                        highLightCircleHoleRadius: 6, // 高亮的圆内半径设置(5.12)
                        highLightCircleOutsideWidth: 2, // 高亮的圆外宽度设置(5.12)
                        highLightCircleColor: '#ffffff', // 高亮的圆圈颜色(5.12)
                        highLightCircleHoleColor: '#e61e1e', // 高亮的圆内颜色(5.12)
                        highLightCircleOutsideColor: '#00ff00', // 高亮的圆外颜色设置(5.12)
                        isVerticalHighlightIndicatorEnabled: true, // 是否选中后显示激活坐标的纵向虚线
                        highLightLineWidth: 1, // 纵向虚线宽度
                        highLightColor: '#c7c7c7', // 选中后显示激活坐标的纵向虚线颜色
                        highLineDashAble: true, // 选中后显示激活坐标的纵向虚线
                        dragableList: [1,1,1], // //拖拽标志列表,0-不可拖拽,1-可拖拽
                        splitEnable: true //是否启用分段样式, splitEnable必须和dragableList配合使用才会起作用
                    }
                ],
                draggingMiniUnit: '1', //
                lineIcon: '',
                lineHighLightIcon: '',
                xAxisColor: '#f2f2f2', //x轴线的颜色,如果不设置,则默认是黑色线
                xAxisLabelColor: '#000000', //x label的字体颜色,如果不设置,则默认是黑色字体颜色
                yGraduationLabel: '', //y轴的刻度单位(5.12)
                yAxisColor: '#FFFFFF', //y轴线的颜色,如果不设置,则默认是黑色线
                yAxisGridColor: '#F2F2F2', // y轴上的分割线颜色
                yAxisLabelColor: '#AAAAAA', // label的字体颜色,如果不设置,则默认是黑色字体颜色
                yAxisLabelCount: 14, //强制限制y轴的刻度数量(5.12)
                //"yAxisLabelIgnoreCount":2,//忽略 y轴 标签的间隔数,例如 2,则每两个标签,就忽略不显示一个(5.12)
                yAxisMaximum: 30, // y轴的刻度最大值,不传则自适应生成(5.12)
                yAxisMinimum: 17, // y轴的刻度最小值,不传则自适应生成(6.0)

                yAxisLabelDecimal: '0', //y轴精确到几位小数,0 则不显示小数
                yRightAxisEnable: false, //是否打开右边的y轴,默认为false(5.12)
                yRightGraduationLabel: '升', //y轴的刻度单位(5.12)
                yRightAxisColor: '#000000', //右边 y轴线的颜色,如果不设置,则默认是黑色线
                yRightAxisLabelColor: '#AAAAAA', //右边 label的字体颜色,如果不设置,则默认是黑色字体颜色
                yRightAxisLabelCount: 6, //强制限制 右边 y轴的刻度数量(5.12)
                //"yRightAxisLabelIgnoreCount":2,//忽略 右边 y轴 标签的间隔数,例如 2,则每两个标签,就忽略不显示一个(5.12)
                yRightAxisMaximum: 2, //右边 y轴的刻度最大值,不传则自适应生成(5.12)
                yRightAxisLabelDecimal: '2', //右边 y轴精确到几位小数
                background: '#ffffff', //不传,则默认使用透明背景
                yAxisGridLine: true,
                xAxisGridLine: false,

                xAxisGridColor: '#00ccb8', //x轴上分割线颜色
                xAxisGridAlpha: 0.5, //x轴上分割线透明度
                yAxisLabelShow: true,
                dragHightEnabled: true, //高亮的时候是否能拖拽,默认为false

                // marker: {
                //   markerShow: true, //默认为false,不显示maker
                //   markerColor: '#00ccb8', //默认为黑色,marker的背景色
                //   markerTextColor: '#ffffff', //默认白色,marker字体字颜色
                //   markerTextSize: '12', //默认12
                //   markerCornerRadius: '3', //圆角
                //   markerGraduationLabel: '℃', //显示单位 默认为空""
                //   markerOffsetY: 40 //垂直间距设置
                // },

                // barSelectIndex: '2', //选中Bar的index(从0开始),默认没有选中态(5.10)
                xAxisLabelHighLightColor: '#000000', //x轴刻度选择后颜色(5.10)
                xAxisLabelHighLightThicke: true, //x轴刻度选择后字体是否加粗(5.10)
                description: '',
                legend: {
                    position: 'TOP_LEFT', //"TOP_LEFT"/"TOP_RIGHT"
                    orientation: 'HORIZONTAL' //"HORIZONTAL"/"BOTTOM_RIGHT"
                },
                legendHide: true, //是否需要隐藏legend,默认不隐藏
                unit: {
                    x: '',
                    y: ''
                },

                signPost: {
                    //底部滑杆界面  (5.12)
                    lineHeight: 1, //线条的高度
                    lineColor: '#E5E5E8', //标签线的颜色 如果不设置,则默认是黑色线
                    linePointRadius: 3, //标签线上圆点的半径, 默认10
                    lineMarginTop: '5', //线条距离X轴的距离
                    lineMarginBottom: '0',
                    cursorColor: '#e61e1e', //标签(三角形)的颜色 如果不设置,则默认是黑色线
                    cursorMarginTop: '5', //标签(三角形)距离线条的距离
                    cursorHigh: '10', //标签(三角形)本身高度
                    cursorMarginBottom: '0',
                    show: true, //默认是 false 是否显示底部界面
                    showType: 'ends', //端点的显示样式,支持 all,ends,none 三种模式
                    isSelectedDisappear: true, //是否标签 滑动到的端点消失不见
                    isSelectedShake: true, //选择后是否支持震动,默认不支持,因为震动体验问题,该功能仅ios支持 (5.10)
                    isInterceptTouch: true //滑动是否拦截手势,android仅有(6.7)
                }
            }
        }
    }
    methods: {

    }
}
</script>
<style scoped>
.linechart {
  height: 700px;
  /* border: 1px solid red; */
}
</style>
# Attributes
参看代码
# Events
| 事件名称 | 说明 | 回调参数 |
|---|---|---|
| onLineDrag | 坐标点被拖动后的事件 |